
1. Problem Definition
An oil and gas company is reviewing the problems that leading to delays and cost overruns. As a lesson learnt for next project, the need to focus on the significant issue and also to identify the problems which have the greatest cumulative effect on project delays and cost overruns.
2. Identify the Feasible Alternative
According to historical data for last 10 years, there are top 10 problems that leading to delays and cost overruns i.e.
- Insufficiently defined FEED
- Inadequate design basis for oil and gas production rates and properties
- Inaccurate cost estimates by the contractor due to inadequate FEED definition
- Ambiguity of the contract documents, leading to disputes over technical specification requirements
- Inadequate documentation to support positions and resolve issues that develop during the execution of the project or retrospectively when large claims develop at the end of the project.
- Multiple change orders are approved during the project or remain unresolved until the end of project
- Insufficient management of multiple prime contractor design and construction interfaces
- Owners often do not have a sufficient number of experienced personnel to manage the technical aspects of a project.
- Inadequate baseline schedule development and updating by contractors, leading to unreliable progress measurement, uncertain critical paths, and inability to mitigate delay.
- Owners do not develop a sufficient master project schedule that results from pulling together the work activities from multiple prime contractors.
3. Development of the Outcome for Alternative
Pareto chart will be generated for analyzing what problems need first attention. Pareto chart is a vertical bar graph in which values are plotted in decreasing order of relative frequency from left to right.
Table 1. Top 10 problems that leading to delays and cost overruns occurrence in last 10 years

4. Selection Criteria
The company prefer to focus only at 20% of the significant problems which will cover minimal 80% of the problems.
5. Analysis and Comparison of the Alternative
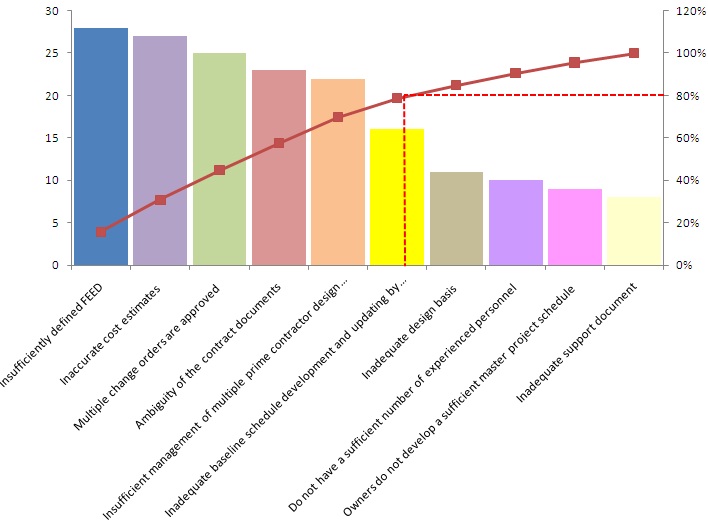 Figure 1. Pareto chart analysis
Figure 1 shows that the most problems that causing cost overrun and company shall pay attention to is insufficiently defined FEED.
6. Selection of the Preferred Alternative
According to figure 1, the company should focus only on top 6 problems below :

If the company can handle the above top 6 problems, it means they have solved almost 80% of the overall problems.
7. Performance Monitoring and the Post Evaluation of Result
After knowing the top 6 significant problems to focus on, the company needs to do several actions to solve the problems. Then they should monitor the result on quarterly basis whether a significant improvement has been achieved.
Reference
- Long,R.J (2014).Typical problems leading to delays, cost overruns, and claims on process plant and offshore oil and gas projects. Retrieved from: http://www.long-intl.com/articles/Long_Intl_Typ_Probs_Leading_to_Delays_Cost_Overruns_and_Claims_on_Proc_Pl_and_OffShore_O-G_Projs.pdf http://woodworkinstitute.com/news/documents/news/WITheBusinessOwnerNovDec09.pdf
- Bassard, Michael & Riter, Diane (2010), The Memory Jogger 2nd Edition, Canada, GOAL/QPC
- McDonough, Michele, Creating Pareto Chart with Microsoft Excel, Sep 13, 2012, retrieved from http://www.brighthubpm.com/templates-forms/8708-creating-pareto-charts-with-microsoft-excel/

Absolutely AWESOME, Andhy!!!
Great case study, excellent analysis and your citations were near perfect….. Just doesn’t get much better than this!!!
BR,
Dr. PDG, AACE Annual Symposium, New Orleans LA, USA
Thank you Dr, PDG,
Best Regards,
Andhy L
Pingback: W4_AsmaF_Pareto Chart for analyzing the causes behind the projects delays and budget exceeding | PMI-Oman 2014
Pingback: W4_Hassan Albarrami_Pareto Chart | PMI-Oman 2014
Pingback: W4.1_Hassan Albarrami_Pareto Chart | PMI-Oman 2014
Pingback: W4.1_AsmaF_Pareto Chart for analyzing the causes behind the projects delays and budget exceeding | PMI-Oman 2014
Pingback: W11.0 – Ahmed AL-Abri- Pareto Chart | PMI-Oman 2014
Pingback: W4_HI_Pareto Chart | GARUDA AACE 2015
Pingback: W15_WRP_Problem Focus Using Pareto Analysis | GARUDA AACE 2015
Pingback: W2_MK_Identify problems using Pareto Analysis – TEAM PHOENIX PROJECT MANAGEMENT LEARNERS GROUP